Heat Stress Assessment
Heat stress in housing, quantified.
Most California multifamily buildings — existing and new — have never been assessed for overheating risk. A2 Efficiency measures it unit by unit, identifies which design decisions are driving it, and shows what reduces it.
01 / The Problem
Heat is California's deadliest weather hazard.
Recent events in California have put heat risk in sharp focus. Extreme heat quietly claims more lives each year than wildfires and flooding combined — yet most of the housing stock was built for a climate that no longer exists.
Efficiency upgrades can make overheating worse.
Tighter envelopes, more insulation, and reduced infiltration cut heating bills — but they also trap heat if glazing, shading, and ventilation aren't designed together.
Title 24 compliance doesn't test for this. No California code does. A building can pass energy code and still reach dangerous indoor temperatures during a heat wave.
02 / The Method
How we assess heat stress — hour by hour.
We simulate how a building gains and sheds heat across the entire cooling season, using its real geometry, materials, orientation, and occupancy patterns.
Using physics-based building simulation, we model every hour of the cooling season for the apartments most likely to overheat — top-floor units, west- and south-facing rooms, buildings with high glass-to-wall ratios. These get identified early, so the analysis focuses where the risk actually is.
Both existing buildings and new designs can be assessed. For existing stock, the model is calibrated to as-built conditions and tested against current and projected climate. For new construction, multiple envelope scenarios are compared side by side before anything is locked in.
Results are expressed as health-based thresholds — which units are at risk, by how much, and which design changes close the gap.
- 01Hour-by-hour thermal simulation across the full cooling season
- 02California climate-zone weather data, including forward-looking climate projections
- 03Unit-by-unit analysis — which apartments are at risk and by how much
- 04Multiple envelope and shading scenarios tested in a single model run
- 05Realistic occupancy — night window operation, internal gains from people and appliances
- 06Normal operation and grid-outage conditions both modeled
- 07Results expressed as health-based pass/fail thresholds
03 / Our Rubric
How we define "too hot."
California has no adopted overheating standard. We apply a four-part rubric — adapted from international residential practice — to mark where a home crosses from uncomfortable into unsafe. This is a recommended threshold, not a code requirement.
Annual comfort hours
Daily temperature swing
Peak-hour exceedance
Bedroom night temperature
These are A2 Efficiency's recommended targets — adapted from international residential overheating practice and expressed in °F for California climates. They are not a California code requirement.
04 / Test Case
A concept exercise in California multifamily.
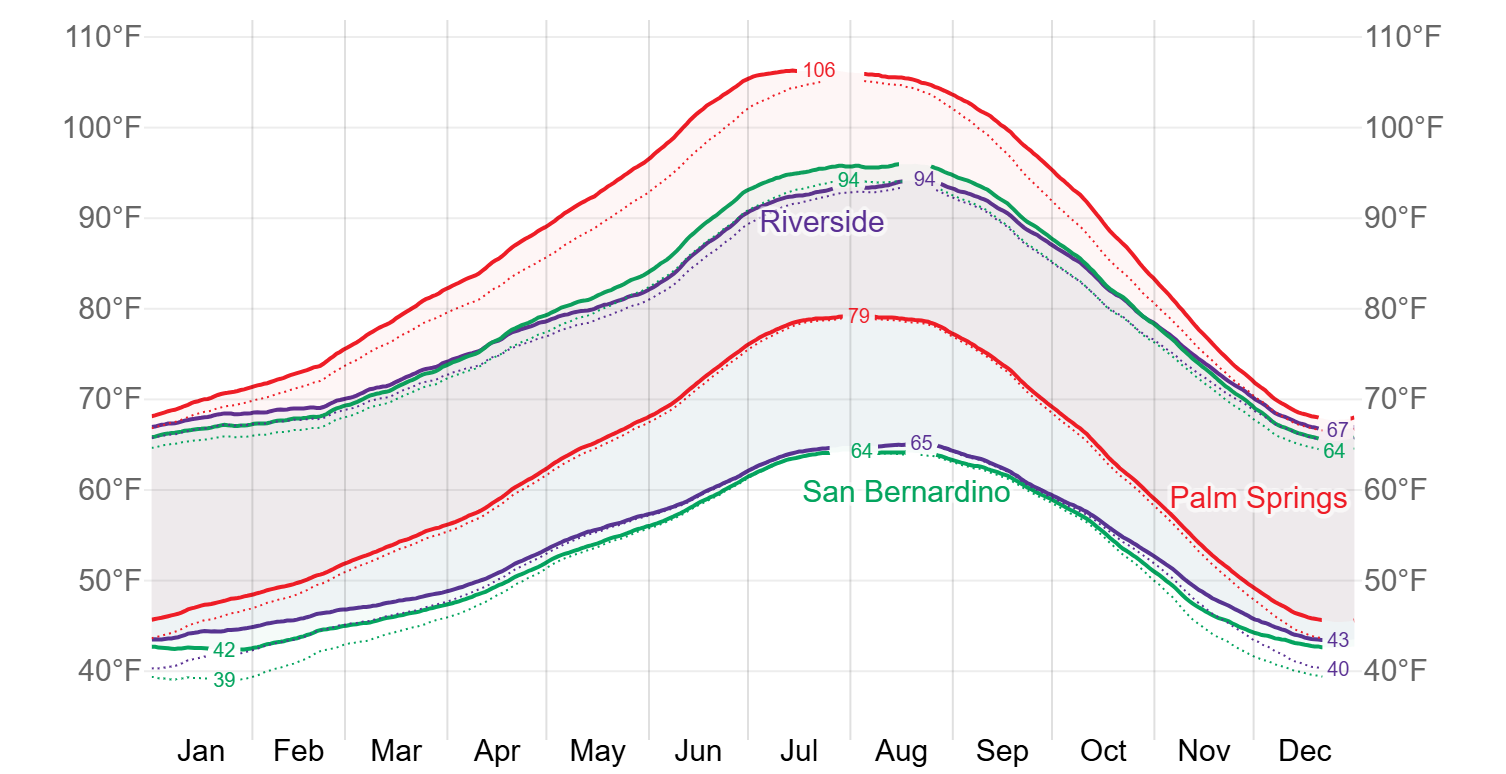
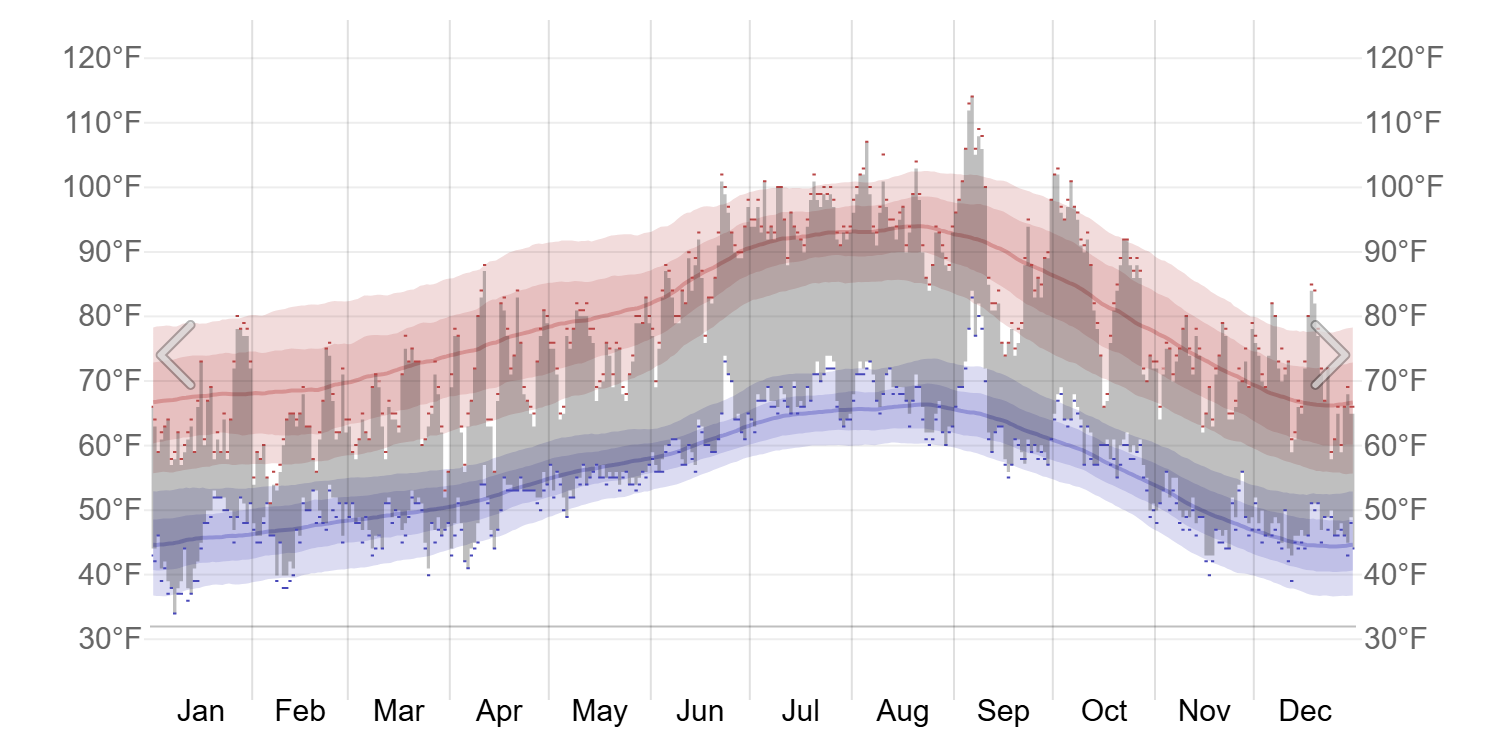
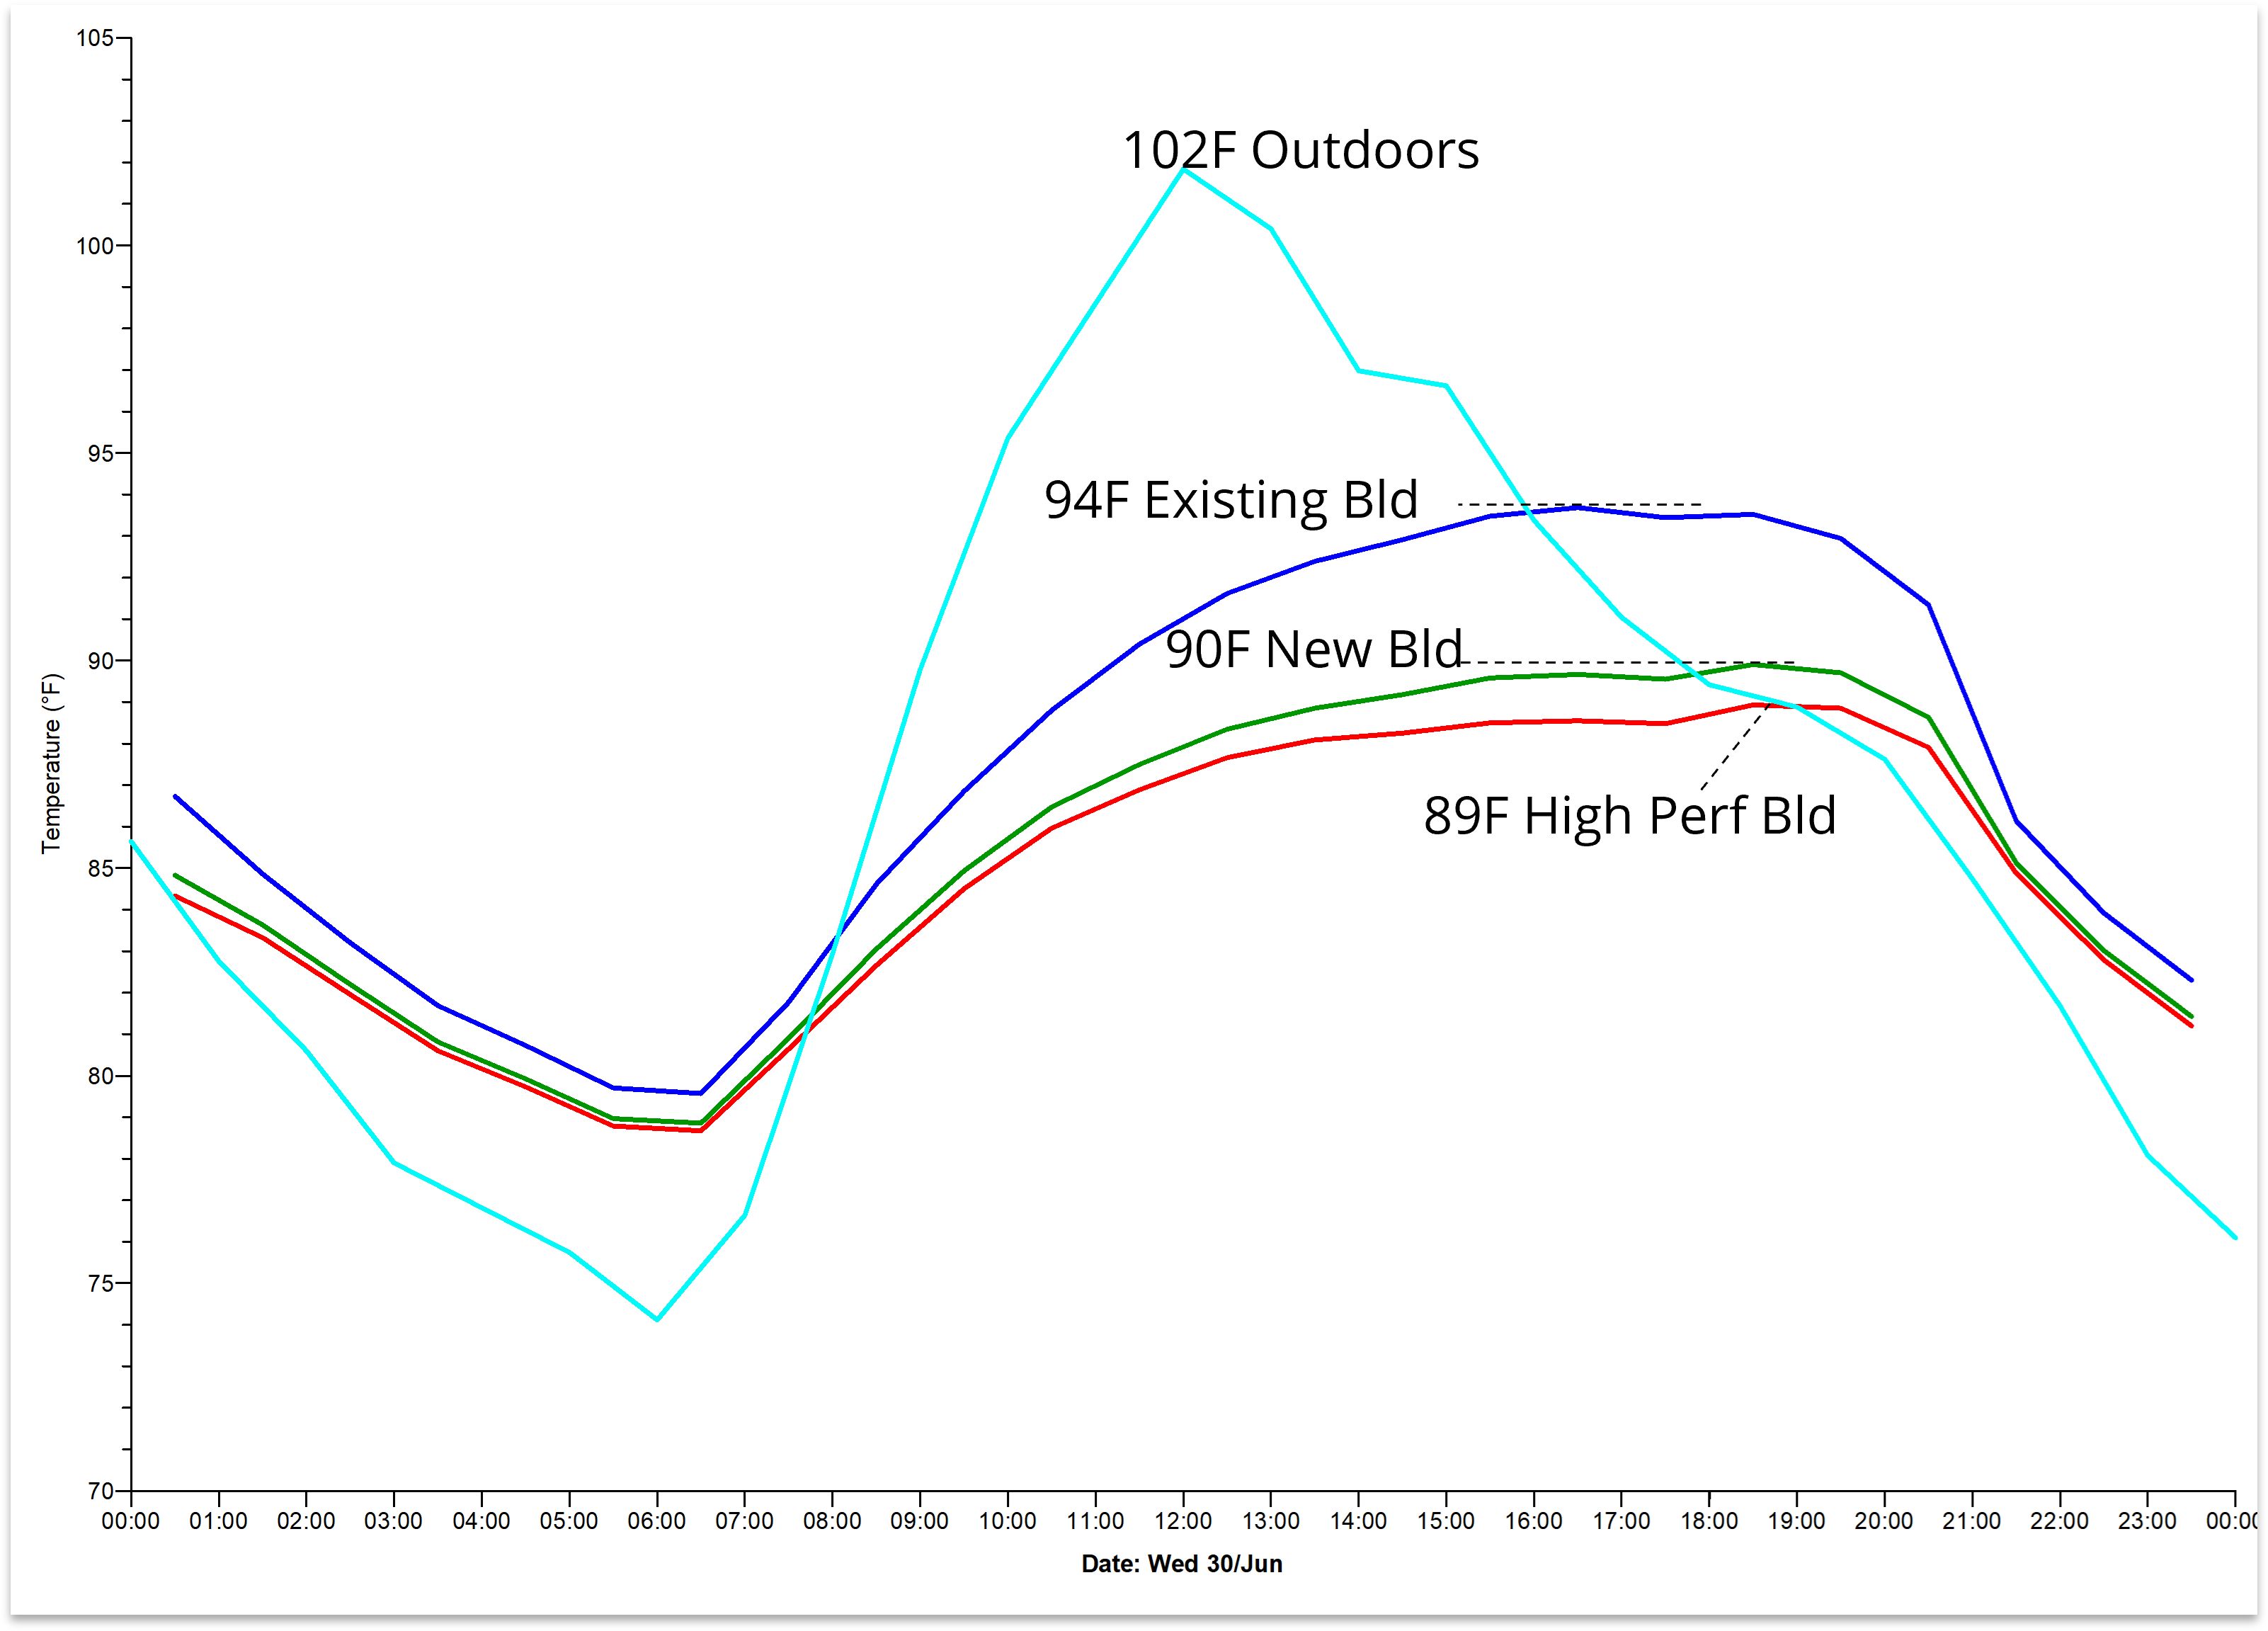
Design thinking, not a built project. We modeled a representative 16-unit multifamily building in Riverside (Climate Zone 9) against the rubric under three envelope standards. Same building, same climate — only the envelope changes.
of units in a brand-new, code-compliant building still fell short of the rubric in this exercise. A high-performance envelope nearly closed the gap — cutting worst-case exposure from 10 hours to 4.
05 / Resilience Scenarios
The conditions your building will actually face.
Grid outages during heat waves are increasingly common — and they remove the mechanical cooling most buildings depend on. We model four operating conditions to show where the building actually holds up.
Full System Operation
The baseline. All active systems available.
- Night flush ventilation via operable windows
- Ceiling fans providing air-movement cooling effect
- In-room or central A/C supplementing passive strategies
No Backup — Envelope Only
The stress test. Passive performance alone.
- No mechanical cooling or powered ventilation
- Operable windows only if outdoor air quality permits
- Exposes which units are genuinely at risk
Stand-Up Fans Available
Battery-powered fans provide airflow without mechanical cooling.
- Portable fans creating air movement
- Modest but real reduction in perceived temperature
- Shows which units this alone is enough for
Battery-Backed Mini System
Small DC-powered plug-in heat pump running on stored energy.
- Targeted cooling for sleeping areas during outage
- Meaningful reduction in bedroom night temperature
- Helps determine minimum system size to reach safe conditions
06 / Deliverables
What the assessment produces.
Results are presented unit by unit, across envelope options, with recommendations ranked by impact and cost — structured to inform decisions at the design or retrofit stage.
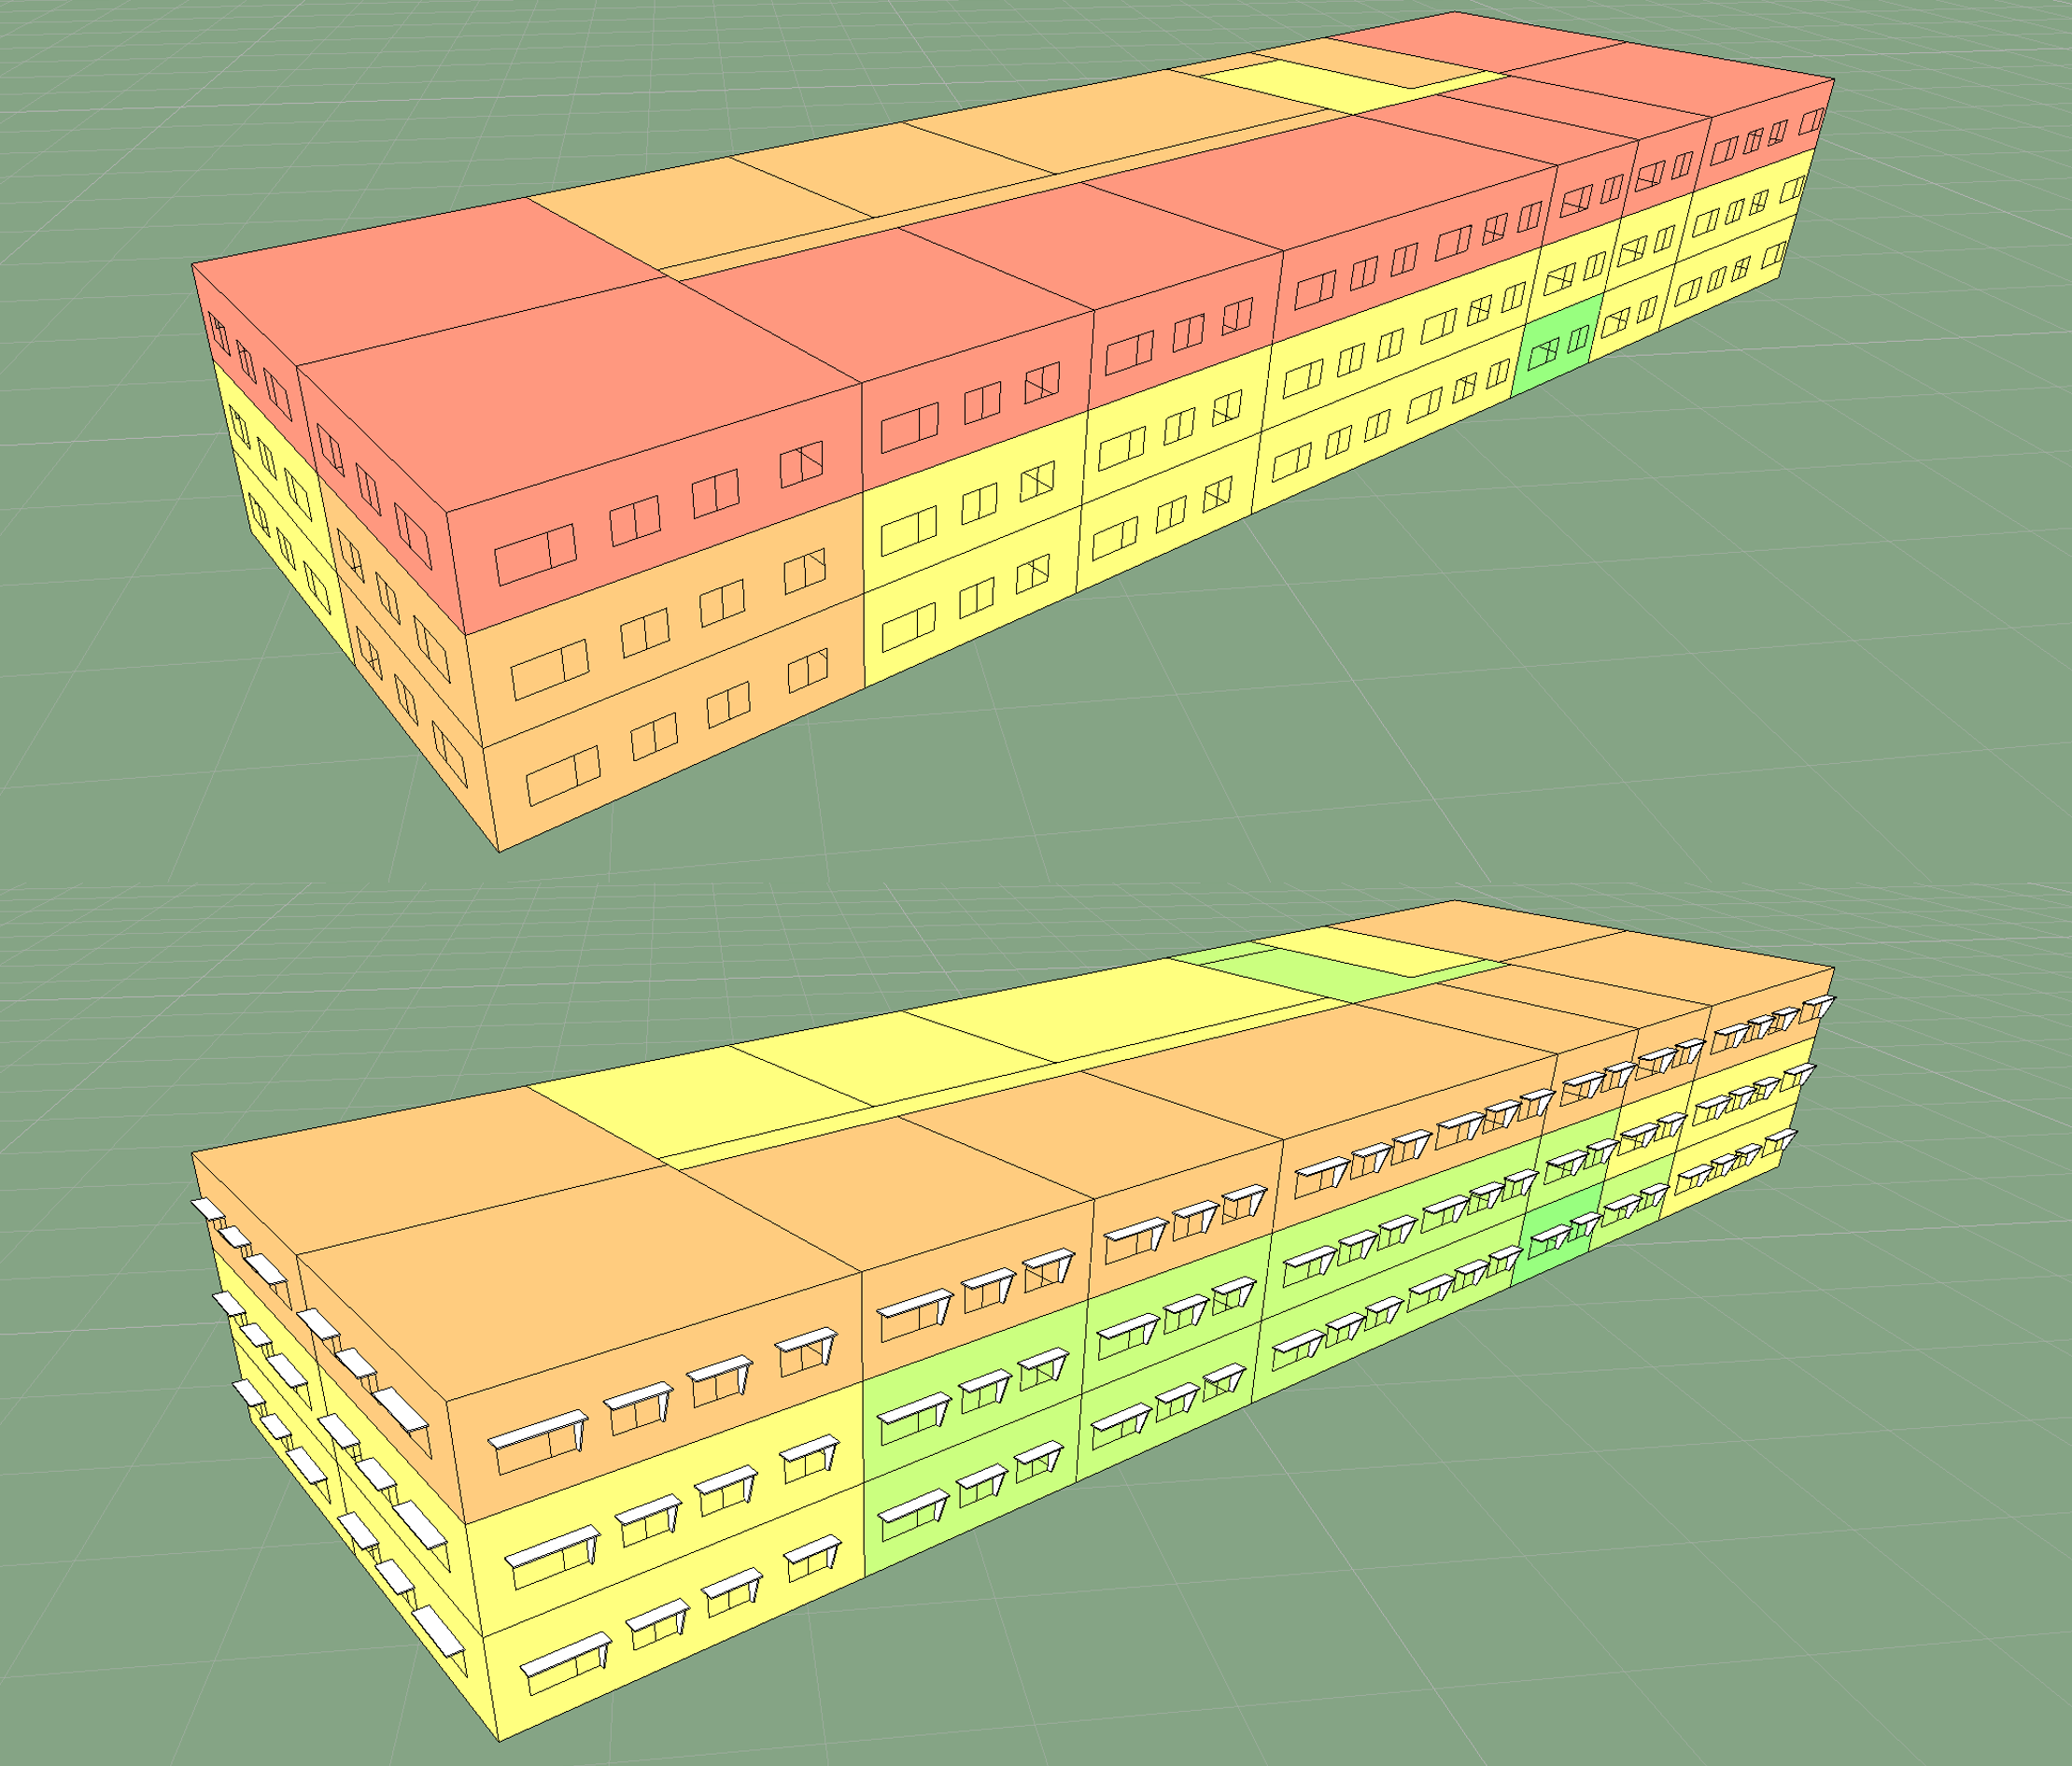
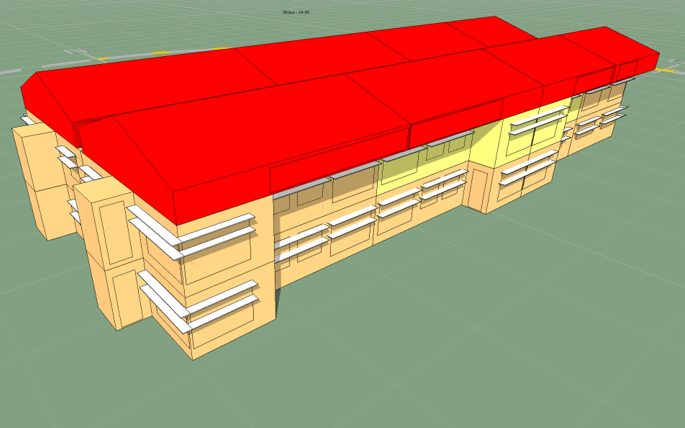
Worst-Case Unit Results
The highest-risk units — top floor, west- and south-facing, highest glazing ratio — assessed against the rubric. Which thresholds are crossed, and by how much.
Envelope Comparison
Side-by-side results across design options, showing exactly what each upgrade buys in terms of passing units.
Ranked Recommendations
Which design changes resolve the most failing units at the lowest cost — ordered so decisions can be made at the right point in design or retrofit.
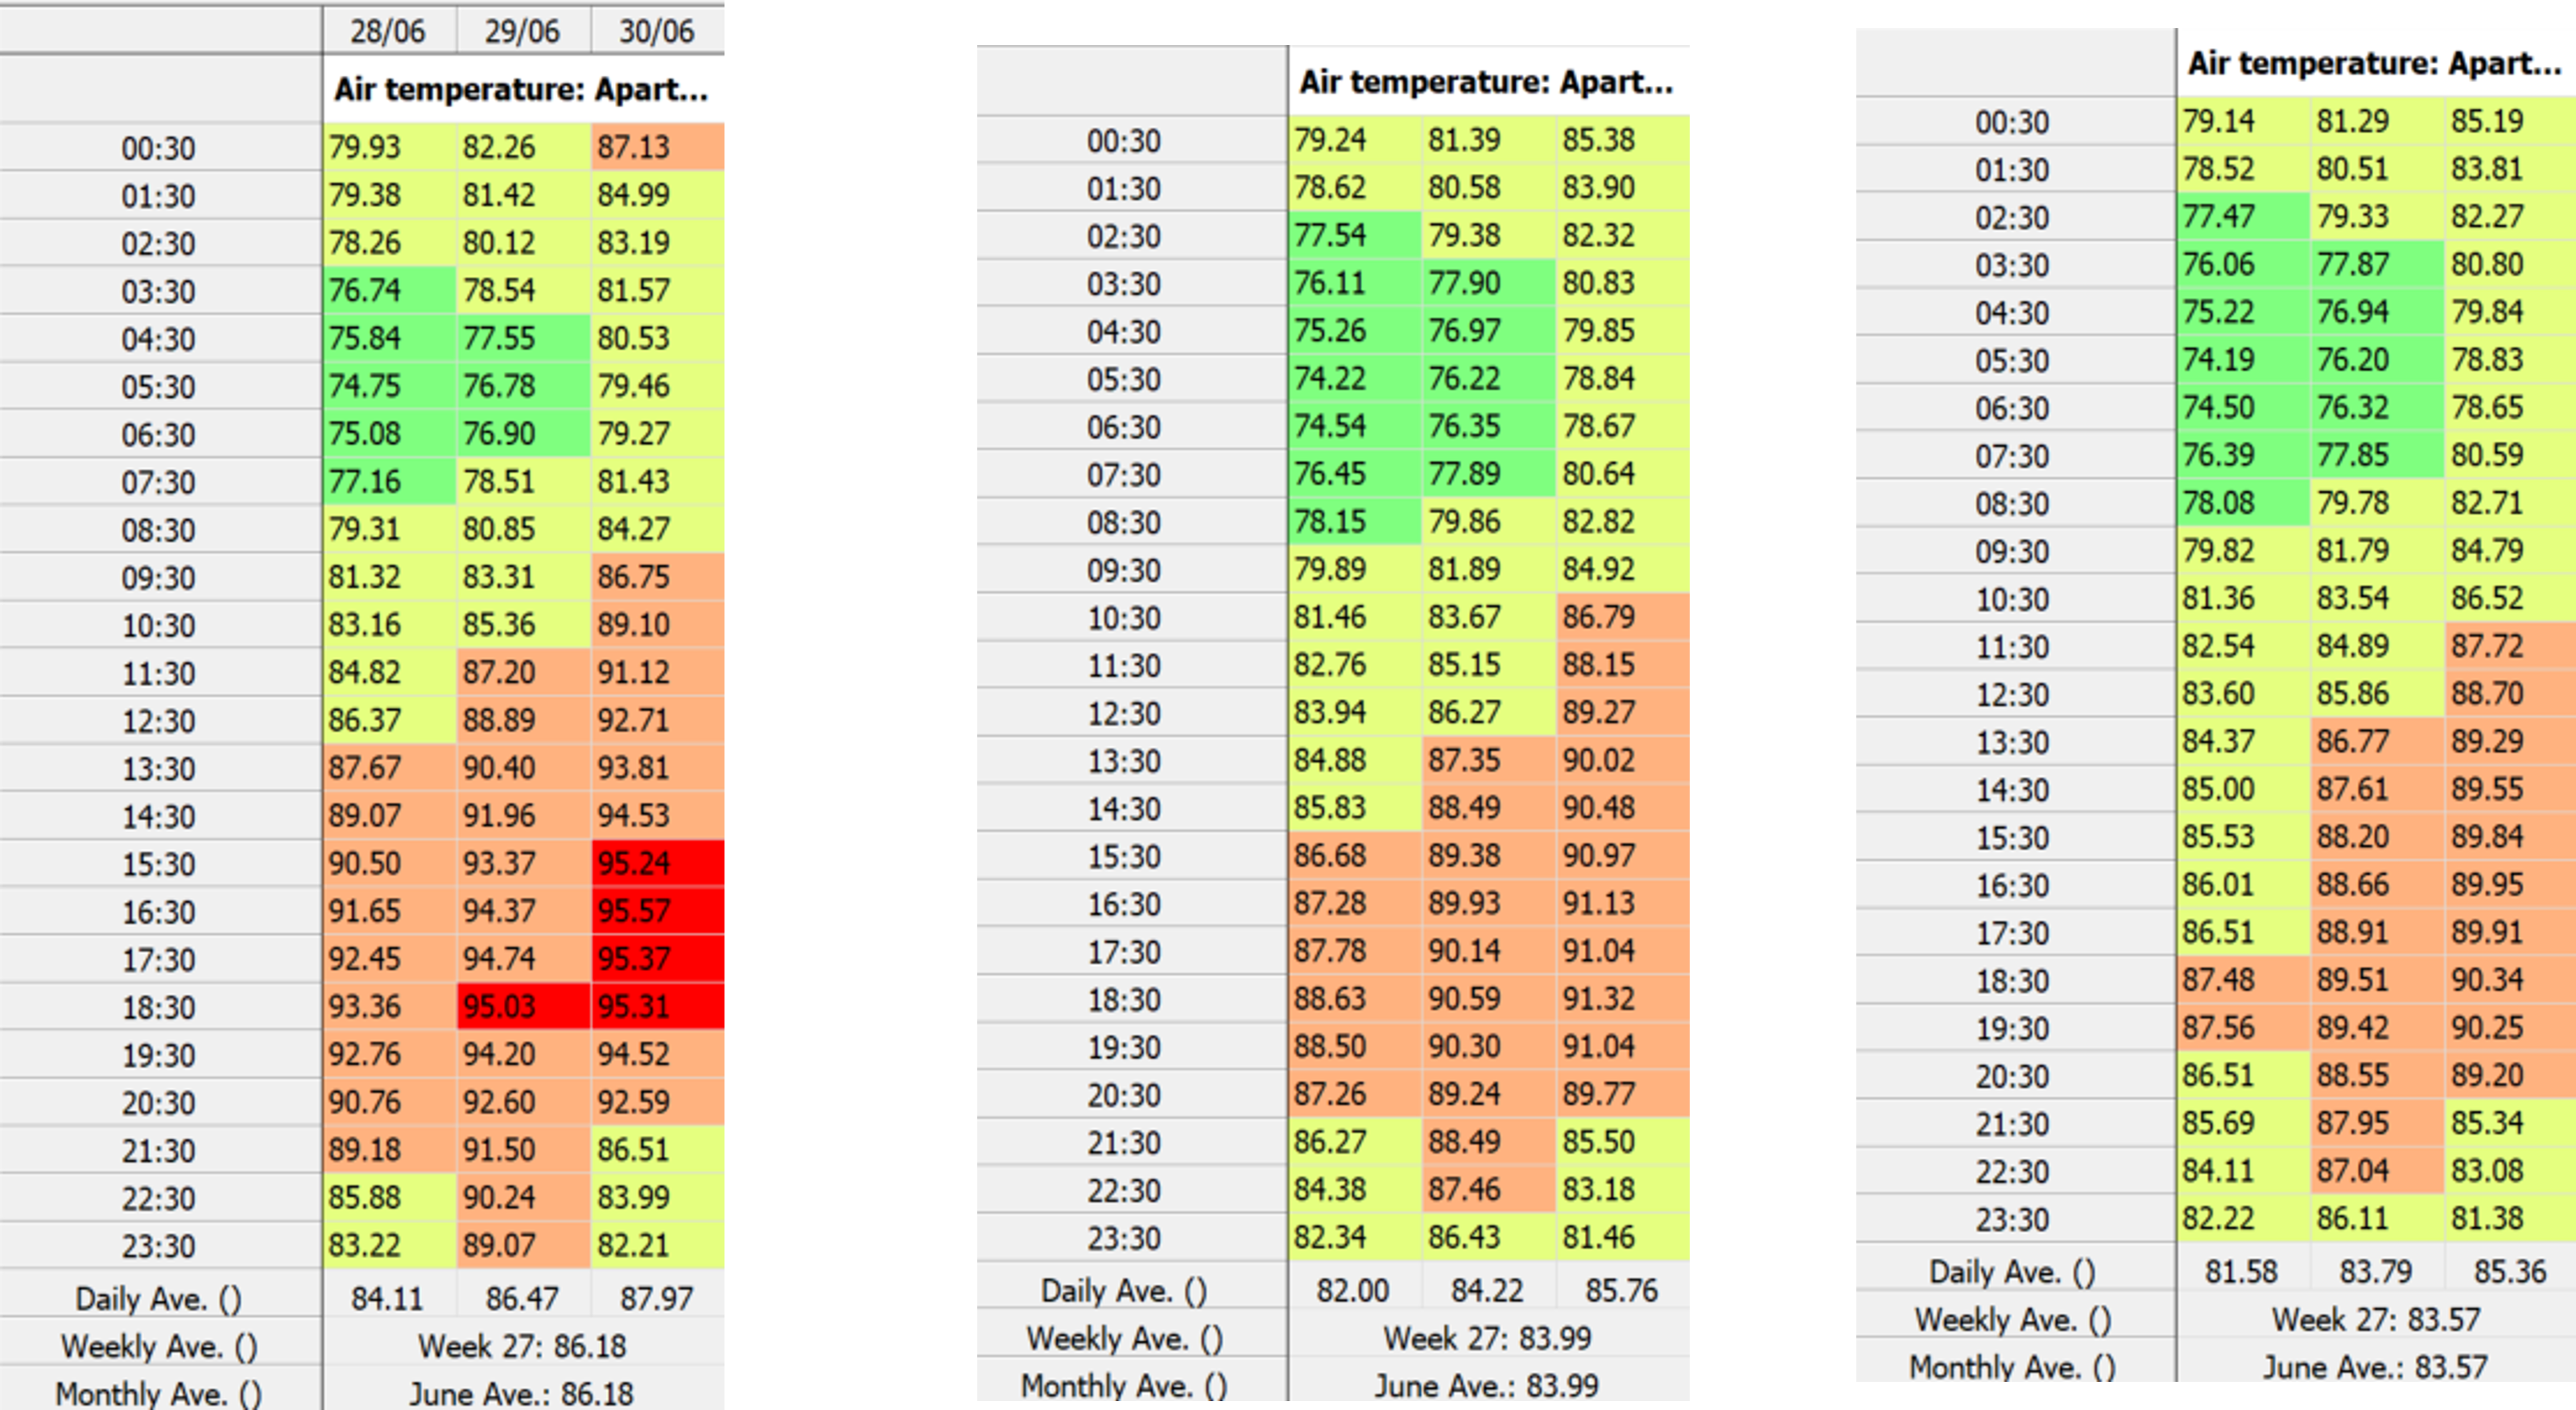
Hour-by-Hour Temperature Data
Hour-by-hour data for the highest-risk units, showing when and how limits are crossed — useful for engineering review and owner conversations.
HVAC Right-Sizing Guidance
A better envelope cuts peak cooling loads 30–45% — smaller systems, lower first cost, lower bills. Quantified for the specific building.
Credit Documentation Package
Formatted outputs covering LEED v5 mandatory prerequisites (IPp1, EQc4) and Enterprise Green Communities thermal pathways.
Example Outputs
Experience & Context
Applied across California climate zones.
California Multifamily Assessments
This approach is built for California multifamily — from coastal Climate Zone 3 to hot inland Zone 9 — informing envelope decisions, retrofit prioritization for aging affordable housing, and IRA / GGRF-backed funding applications.
The pattern repeats: code compliance leaves a meaningful share of units at measurable heat stress risk, and targeted passive improvements close most of that gap.
Discuss a project →Heat Stress & Green Building Standards
LEED v5, Enterprise Green Communities 2026, and PHIUS REVIVE all now include heat-resilience and thermal-survivability requirements — each sharing the same gap between energy compliance and occupied-condition overheating risk.
A heat stress assessment fills that gap with quantified evidence, feeding mandatory prerequisites rather than optional credits.
Get Started
Most overheating problems are invisible until it's 110°F.
An assessment early in design or retrofit planning costs a fraction of late-stage changes. Let's talk through your building.